

Your Linkdeli Stats page provides a full in-depth view of your affiliate product lists performance. Linkdeli tracks each of your affiliate lists and produces graphs, charts and lists that help you analyse your statictics, optimize your affiliate strategy and generate more profit for you.
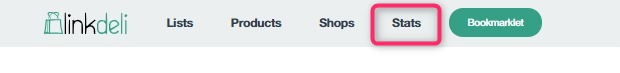
You can access your statistics from your Linkdeli dashboard on the Stats page:
 Overview
Stats page includes an overview of your:
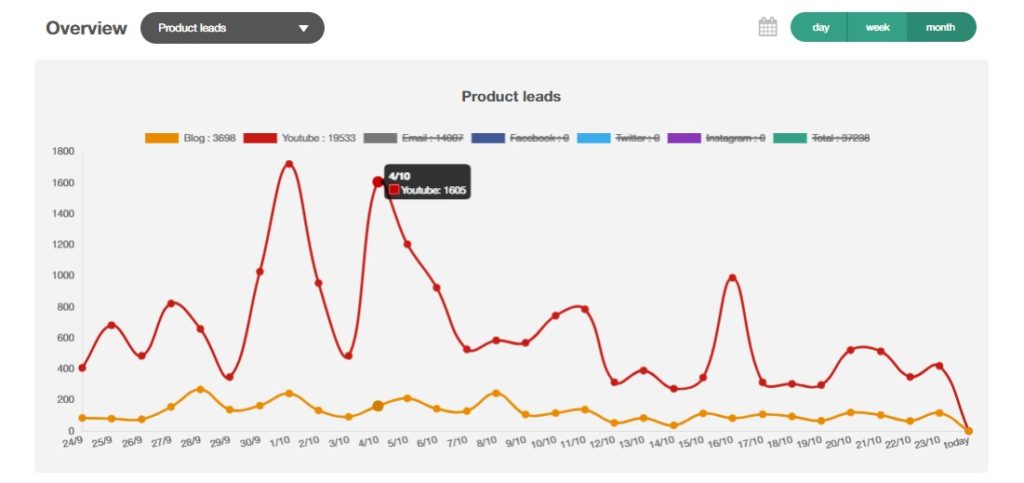
- product leads: this is a visualization of how many clicks your links got in a specific period of time (this can be sorted by day, month or week or you can choose your own time period by clicking on the small calendar icon) and which social networks your leads are coming from
-
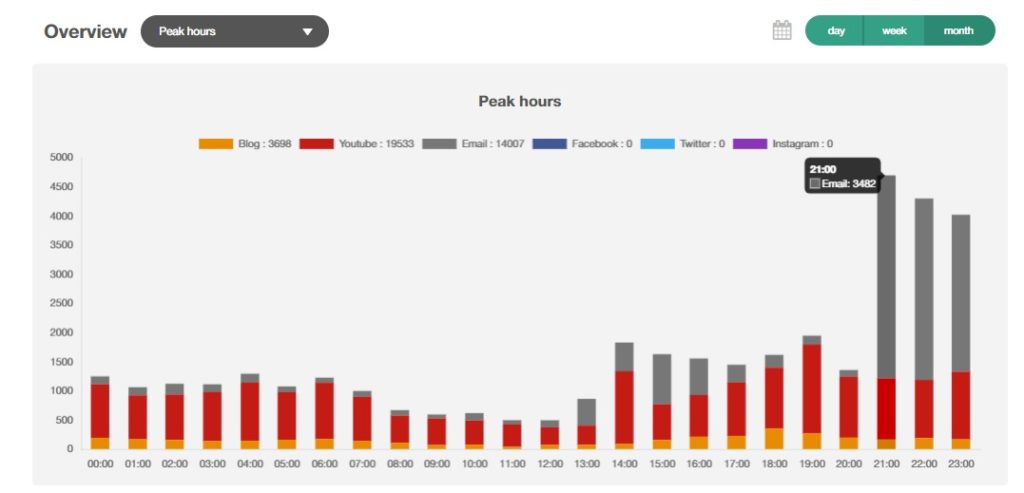
peak hours: it shows what time of day your links get the most leads in a given period. You can use this information to decide when you post your blog posts/videos and when to send out your newsletter to your email list for best performance.
-
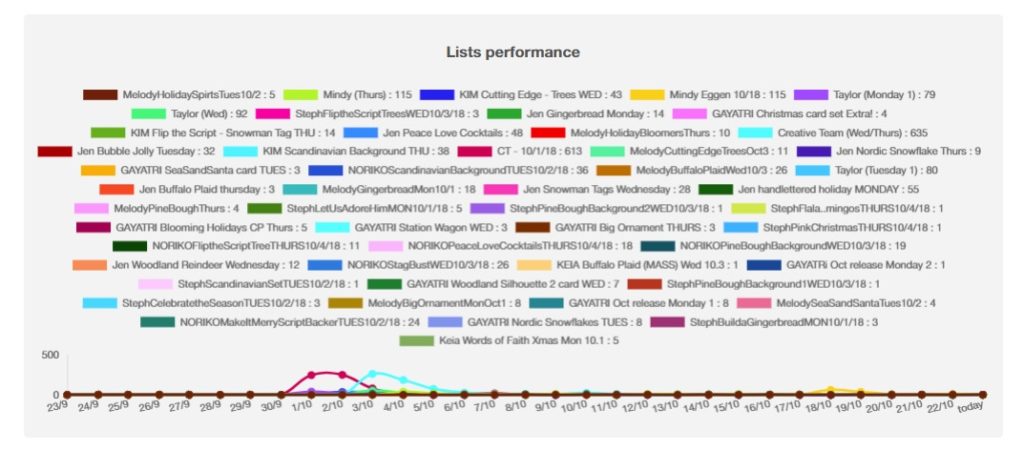
list perforance: These graphs represent how your blog posts or your videos perform, what kind of posts or videos your users prefer and how frequently should you post to keep the clicks to a maximum constant (see below as well).
In these graphs the clicks are displayed per list and per day.
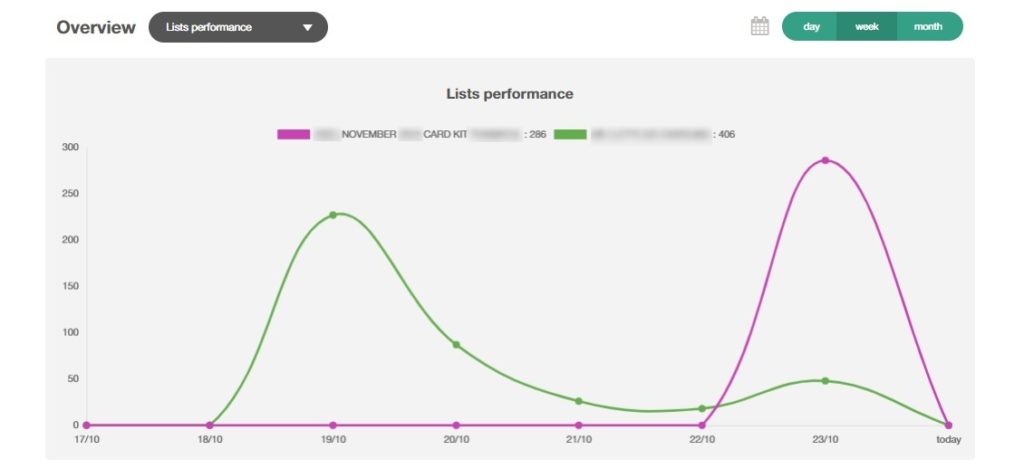
The lists that will show up in the graph are those created within the time range you select.
Using this information, you can optimize your clicks by keeping the peaks close. Since each post/video has a peak in its performance and then drops, you can decide when it is time to post another. This is when the line representing the clicks of your previous post starts to descend.
Your Stats page also includes:
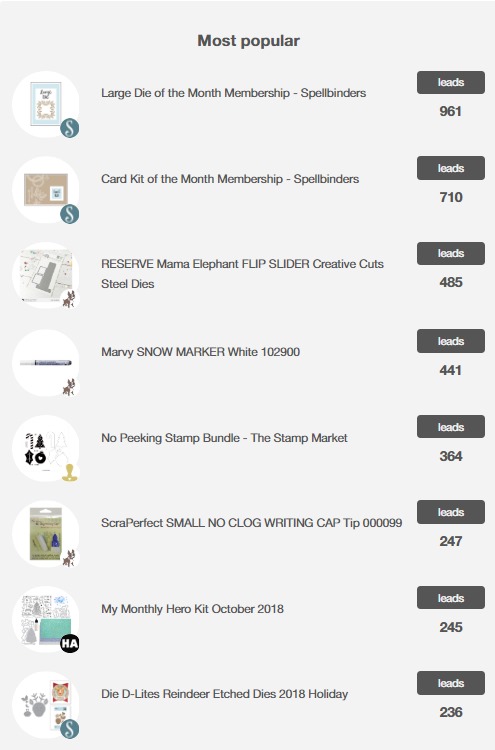
- Most popular products so you can see which of the products you recommend to your audience sell more.
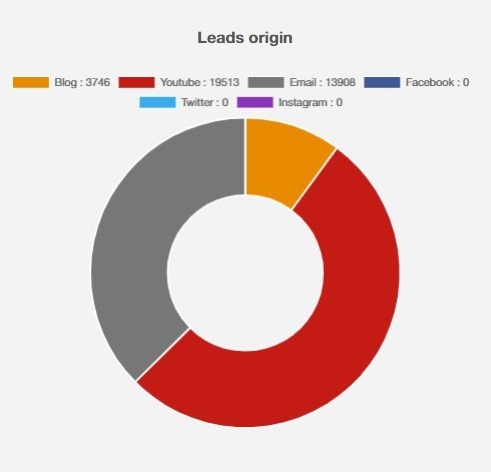
- The Lead’s origin pie chart that represents the social networks with the best performance for you. This could be your blog, youtube channel, newsletter email, Instagram or Twitter. Linkdeli offers multiple options to share your products list within the social networks, so this information is valuable and it helps you focus on the networks that bring you the most clicks and by extension, sales.
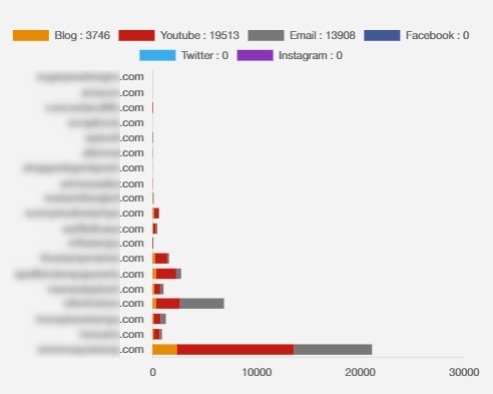
- Lastly, you can have a valuable insight on your readers’ favorite shops so to promote it more heavily or which shop doesn’t generate leads for you and act accordingly.
Video
Are you more of a visual person? Watch the video below:
Want more tutorial videos? Click to subscribe to our channel.
some extras
Leads
Leads are real-human clicks to your links. Everything else (bots, google etc) are filtered out constantly.
YouTube clicks
YouTube clicks are coming from the YouTube code, regardless of where you use that code. Some users may pick the links that are in the youtube part of the code dialog and use them freely around e.g. their social channels. This will still show up as youtube.
Email code
The clicks from the email code are the clicks that are only visible when you use the “email integration” code. This means that if you have used links from the YouTube section for the blogpost, there will be some youtube links being clicked and counted towards the youtube totals. There is a dedicated blog links code that will count the blog’s clicks accurately.
Should you have you any questions, feel free to send us an email.